Digits Recognition Using KNN Machine Learning Algorithm
Introduction
Image recognition is one of the most interesting topics in Machine Learning. Solutions for image recognition problems is needed in different industries such as the gaming industry, security industry, social media platform, and visual search engines. Hand written digits recognition is one of the basic problems in image recognition field. This article is going to discuss a hand written digits recognition solution using
Methodology
1. Dataset acquisition and EDA
This article is going to use a popular open source dataset called MNIST original. It is a dataset consisting of 70,000 images of handwritten digits. The features are the pixels of the image which are 784 pixels and a class label which is the digit value.
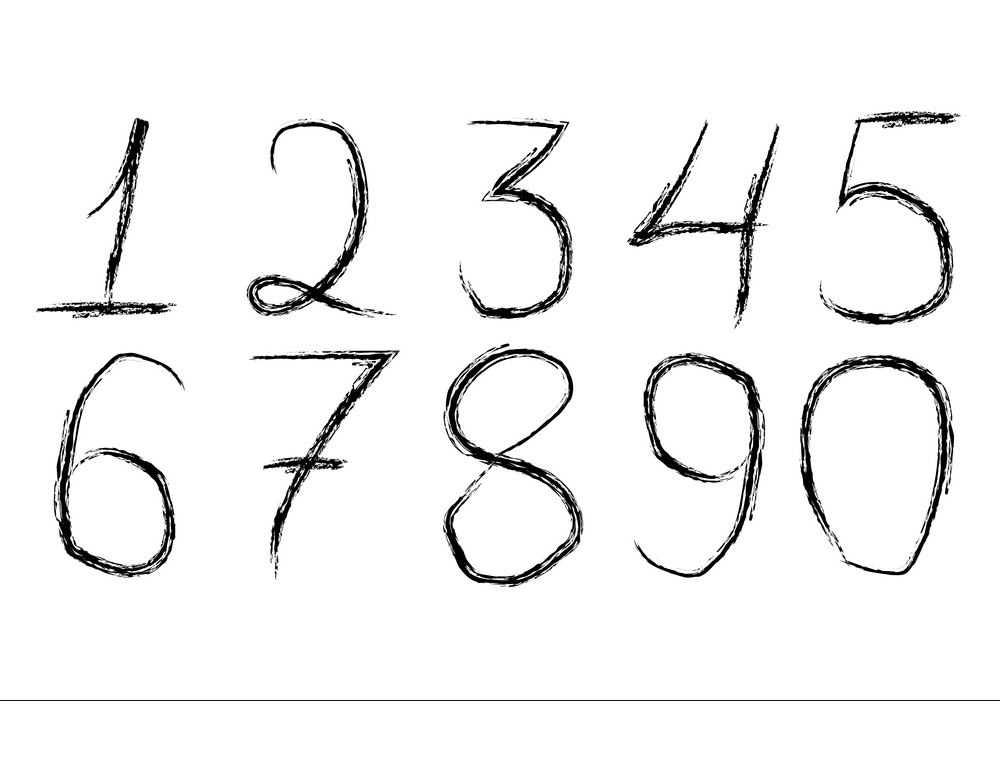
This is what the dataset looks like:
 Figure 1- Sample From Dataset
Let’s take a look at what the features represent after reshaping the 784 features set (pixels) into a square matrix of size 28x28 and plot each pixel color value.
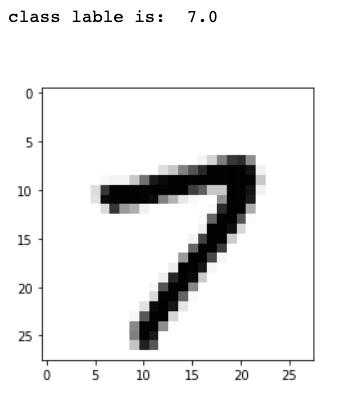 Figure 2- Features Representation For a Single Data Point
And the barchart below represents the classes distribution for this dataset, this shows that we don’t have to worry about class imbalance issues because the dataset is fairly balanced.
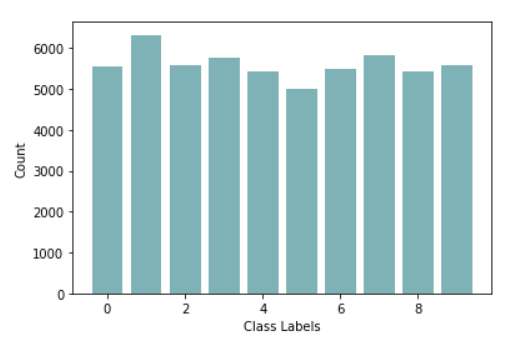 Figure 3- Barchart For The Target Distribution
2. Baseline
The baseline model for this problem was built using K-Nearest Neighbors algorithm with all 784 features. The cross validation score for the baseline model is 0.97, which is great! However, if you are familiar with K-NN or have worked with it, you might be able to guess what’s wrong with this model.. Exactly, time complexity. The big-O notation for K-NN is (d x n), where d is the number of dimensions (features) and n is the number of instances. In my case, for several runs it took between 1h 10min to 4h 20min to build the model. Therefore, to enhance its performance I’ve worked on feature engineering the dataset to reduce its dimensions.
3. Feature Engineering
To reduce the number of dimensions, I did the following:
- Take the features mean from every instance at each class. This will create a shape that is similar to all instances from that class which will act like templates for class labels (see Figure 4).
- Project the test samples through the templates and calculate how much pixels made it through.
- The more pixels pass through a template, the more likely this test sample is identical to this digit shape. This rate is calculated for each instance with respect to each class label. This will result in generating 10 new features for each instance which represent the rate of similarity of this instance to all class labels. These 10 features are used to generate a new dataset and continue the training phase on this dataset instead of the original one (see Figure 5).
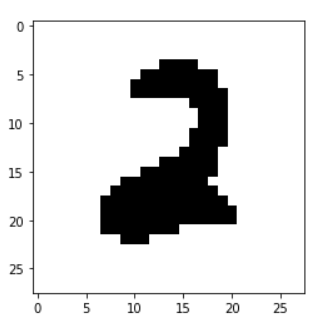 Figure 4- Template For Class Two
 Figure 5- Dataset After Dimensionality Reduction
4- Experiments
After applying dimensionality reduction on the original dataset, I experimented the data with five different Machine learning algorithms. I explored the performance results of them all and summarized it in Table 1.
 Table 1- Performance Results Summary
It seemed to me that K-NN had the best performance compared to other models in terms of accuracy, confusion matrix, AUC, and overfitting potential, and with an acceptable time complexity performance. Moreover, with the help of GridSearchCV I decided to set the number of neighbors to be equal to 14 because it was the value that resulted in the highest accuracy with minimum overfitting potential.
K-NN Performance
While experimenting with different algorithms, I noticed something in common between most weak classifier. That is, they all misclassify certain digits like 3 and 5 with 8, a 5 with a 3, or vice versa. Which make sense because 3, 5, and 8 are similar to each others. However, the final results I got with K-NN showed a good performance in classifying 3, 5, and 8 correctly (see Figure 7-a).
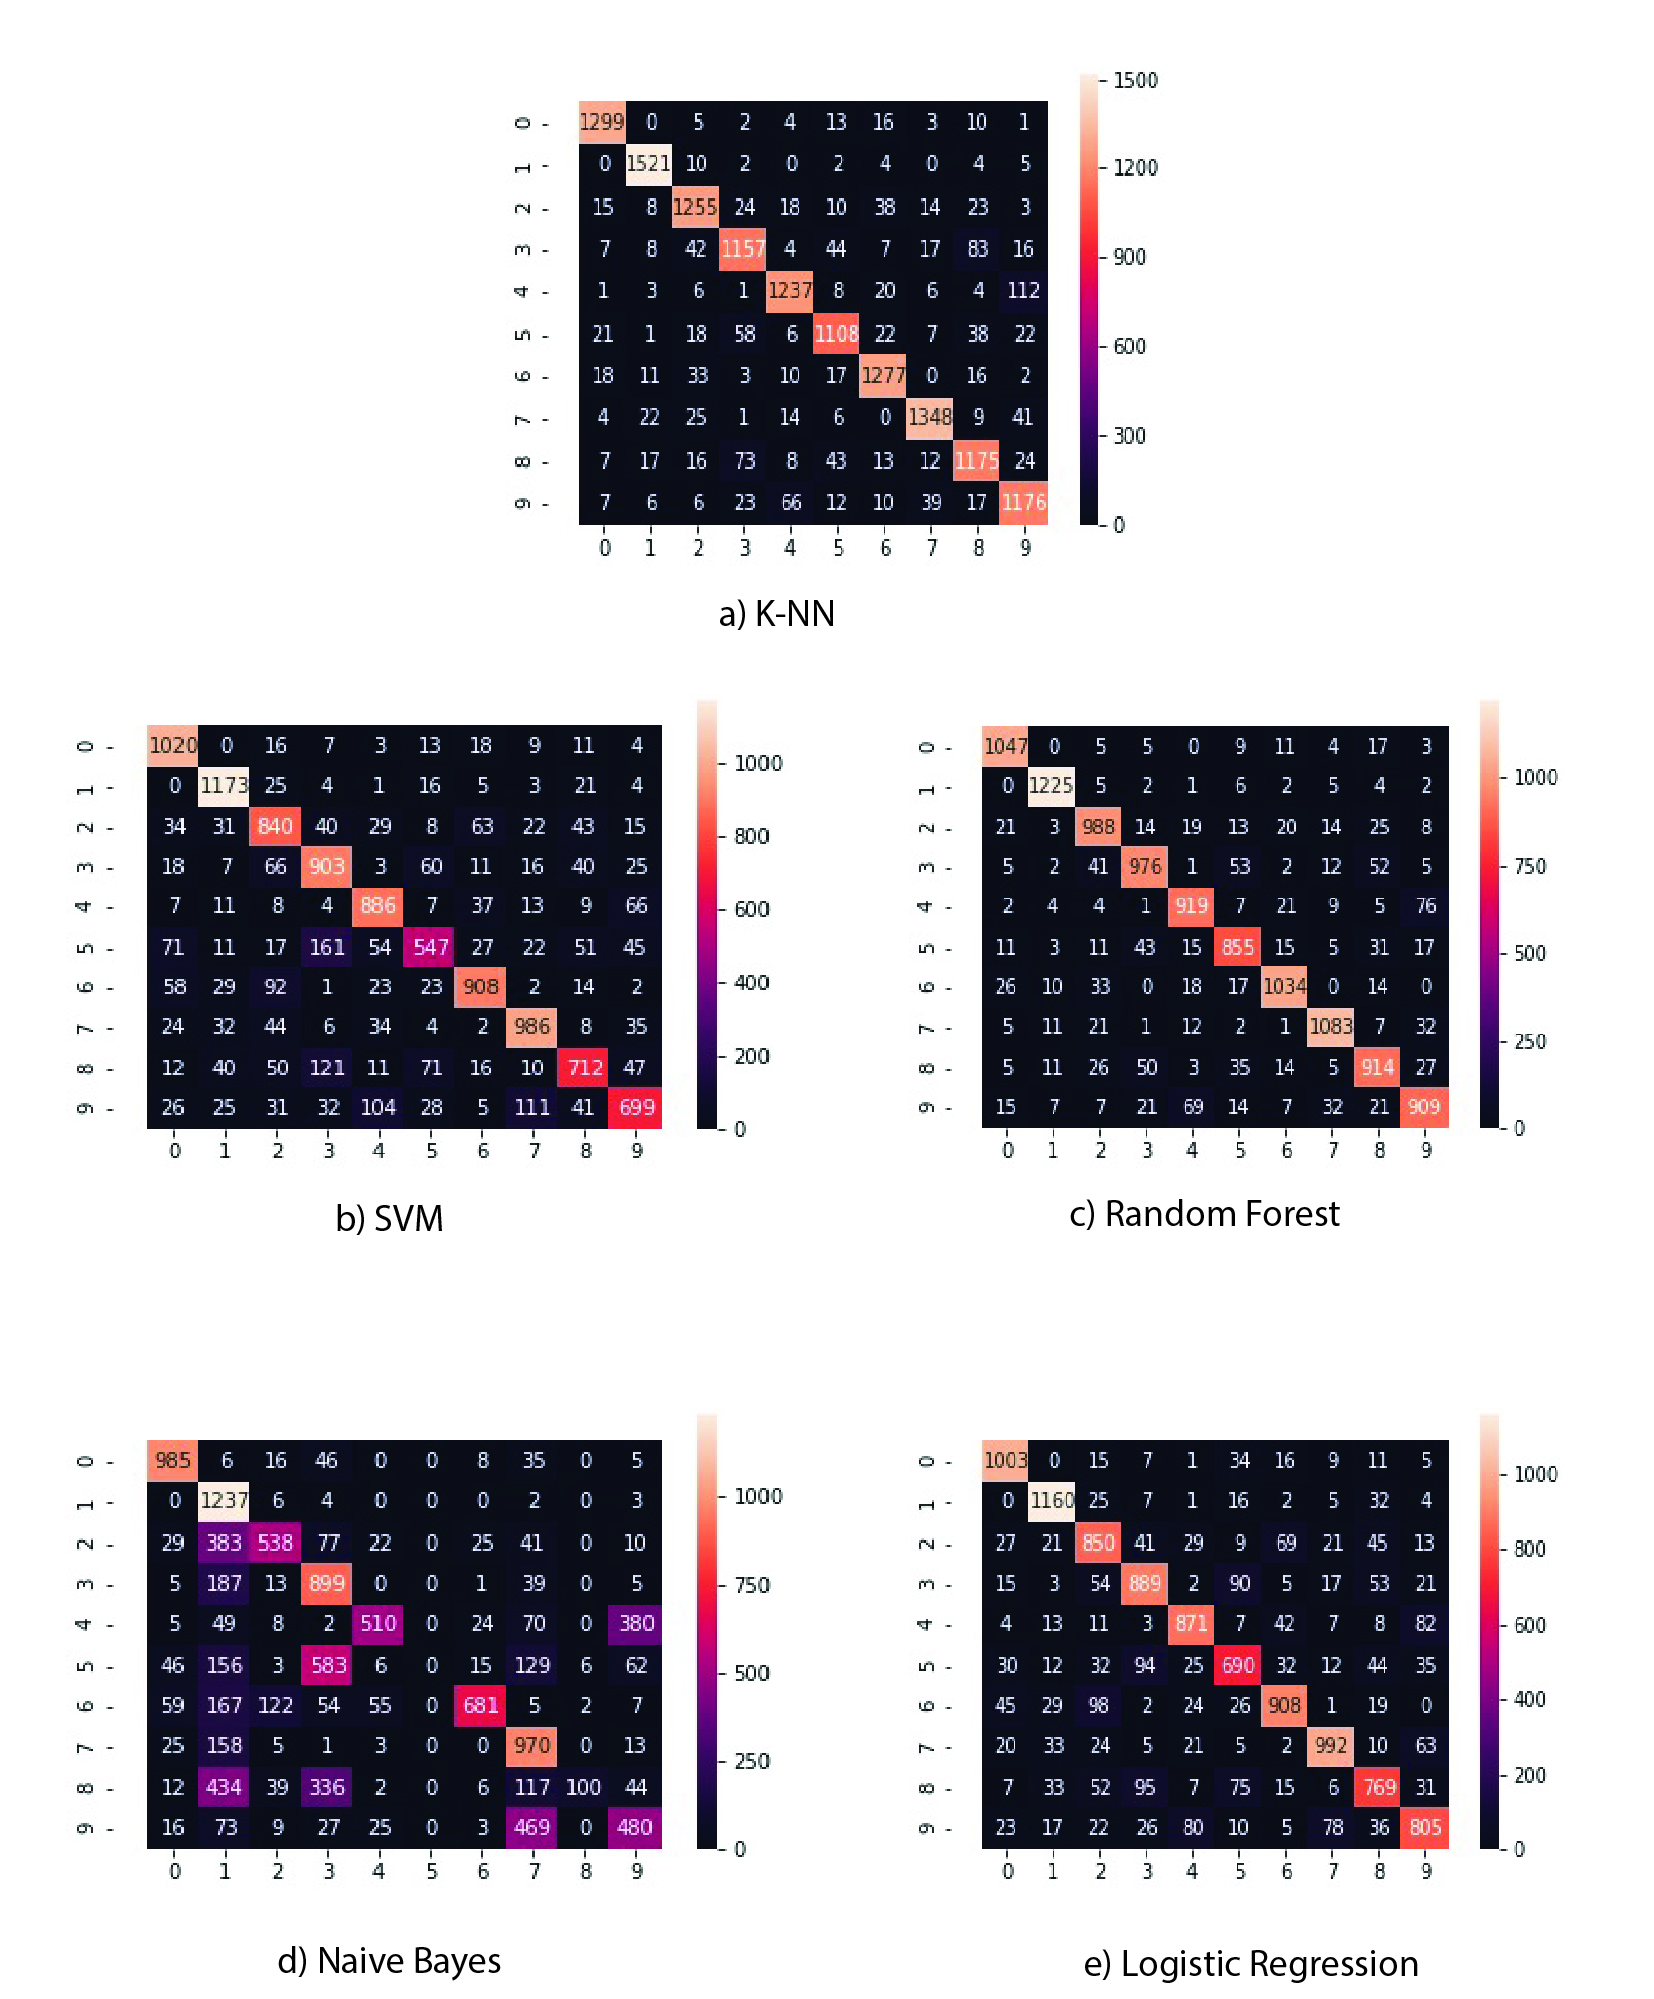 Figure 7- Confusion Matrices For All Experimented Models
You can see from Figure 7 that K-NN has the brightest diagonal, which means it has the minimum number of misclassified instances.
Figure 8 plots the AUC for all 10 class labels using K-NN, which scored the highest minimum curve.
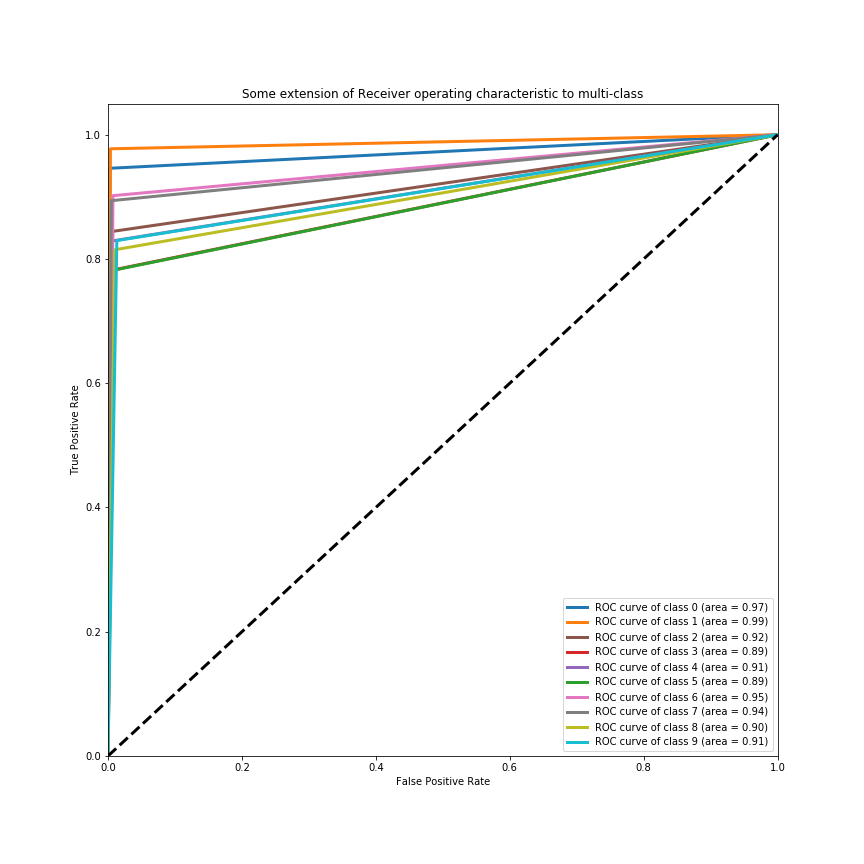 Figure 8- AUC Using K-NN
5-Testing
On testing, K-NN scored 0.8710 accuracy in total of 1min 48s to test 14,000 data points. Figure 9 to Figure 12 shows random samples chosen from the test set with the value predicted by the model.
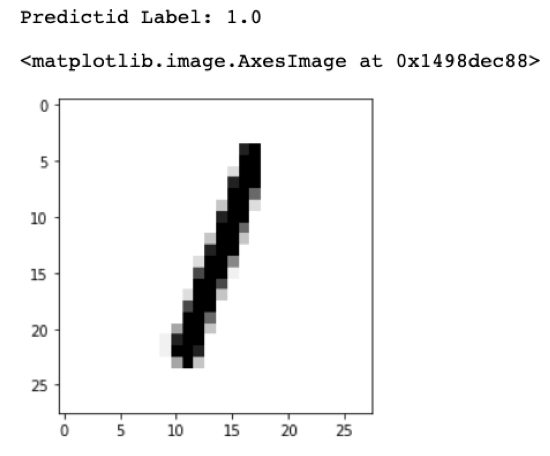 Figure 9- Test Sample 1
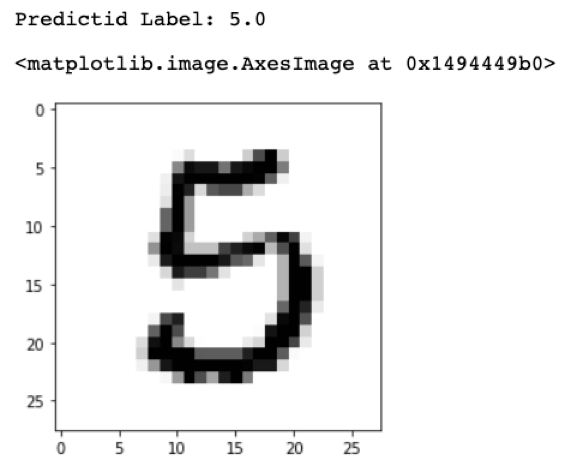 Figure 10- Test Sample 2
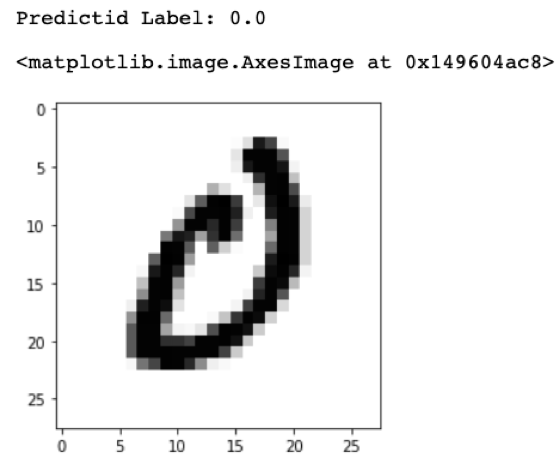 Figure 11- Test Sample 3
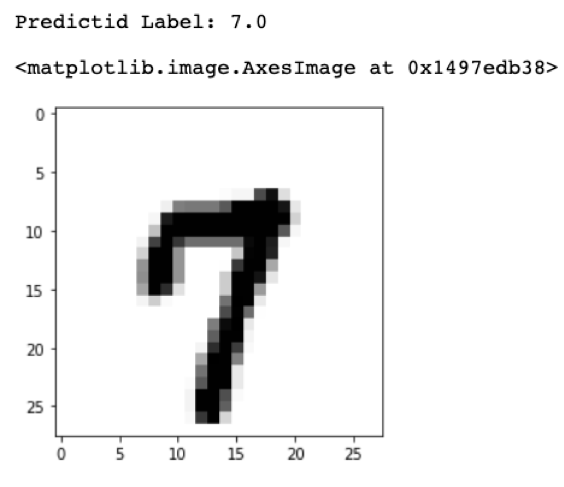 Figure 12- Test Sample 4