MTA Turnstile Data Analysis

Introduction
A client has approached us from WomenTechWomenYes organization asking for our help in data analytics to support some of their work strategies. Since they are having a gala at the beginning of summer, they wish to optimize the effectiveness of their street team work and get as much signatures from people at subway stations in New York city to attend the gala and contribute to their cause.
Hypothesis
The street teams shall be distributed on stations which are applicable to the following conditions:
- Stations with highest traffic records across NYC in May 2019.
- Stations located near to tech companies.
Methodology
1. Data acquisition
We acquired Four datasets representing each week of May 2019 from MTA Turnstile data. This is what the original dataset looks like, and you can find an exact description for each field here

2. Preprocessing
- First, we concatenated the Four datasets into one, and combined the date and time columns into one column named (DATE_TIME) as shown in the Figure below on the first column.

- Then, we deleted columns which were never needed anytime during data processing. Which are: C/A, LINENAME, DIVISION, DESC.
- We created a unique identifier for each turnstile per station (UNIT/SCP). This ID will help us in the coming steps to calculate the total traffic per station.
- We excluded all dataset records which are not in May. The below Figure shows the head of our dataset after excluding these dates. You can see and compare with the previous Figure where the head of the dataset were all on April.

- Given the following inputs:
- Total traffic must be calculated per stations.
- Each station has multiple turnstiles records.
- Each turnstile records must be in sequence and its DATE_TIME values must be in ascending order. This is because each turnstile record is cumulative to itself in time.
We concluded that the whole dataset must be sorted on this list of attributes (STATION, UNIT/SCP, DATE_TIME)
-
Now, the dataset is ready for calculating the actual entries and exits per record which is equal to the entries/exits values minus the entries/exits values in the previous record where station name and turnstile IDs are similar. And the TOTAL_TRAFFIC value equals to ENTRIES_DIFF plus EXITS_DIFF.

-
After calculating the total traffic per record, we observed the existence of abnormal values (outliers). We investigated the reason and found out that some turnstile devices were malfunctioning and producing tremendously huge values which are incorrect. To solve this problem, we came up with a classic detecting and handling outliers solution. The outliers detection was done by calculating the IQR, lower bound, and upper bound for each station. All TOTAL_TRAFFIC values which are less that the lower bound value or higher than the upper bound value will be considered outliers. Once an outliers is detected, it will be handled by replacing its value with the total traffic median value of its station.
3. Visualization
We grouped the dataset by stations and calculated the sum of its TOTAL_TRAFFIC column. Then we plotted a bar chart using SeaBorn representing the top 20 crowded stations in NYC on May 2019.

The Figure below is a graph of one of the top 20 stations representing the total traffic for each day in May 2019. We concluded from the graph that weekdays are the most crowded days unlike weekends.

Decision Making
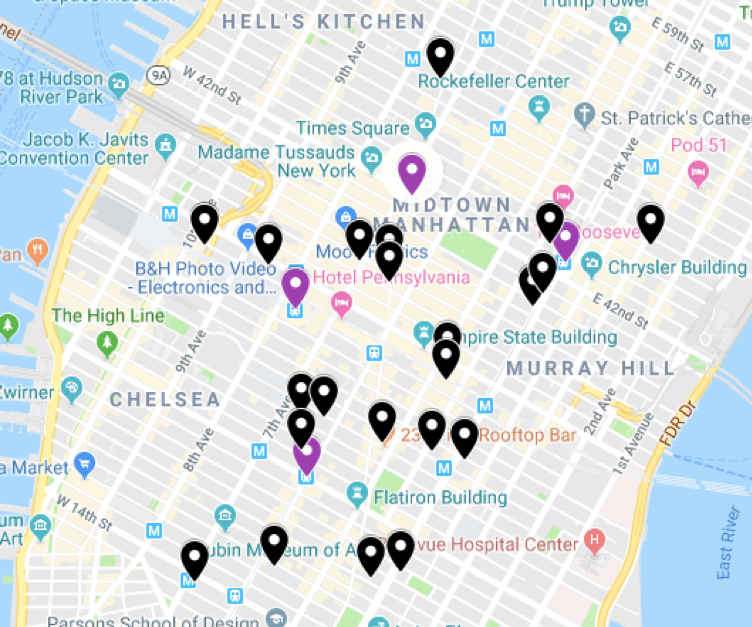
After completing the analysis and visualization, we recommend distributing the teams on the following stations at weekdays:
- 34 ST-PEEN STA
- GRD CNTRL-42 ST
- 23 ST
- TIMES SQ-42 ST
These stations as mentioned before were not chosen due to their highest traffic records only, but because they are also located near to tech companies in NYC. The Figure below highlights the chosen stations locations with purple pins and tech companies locations with black pins.
